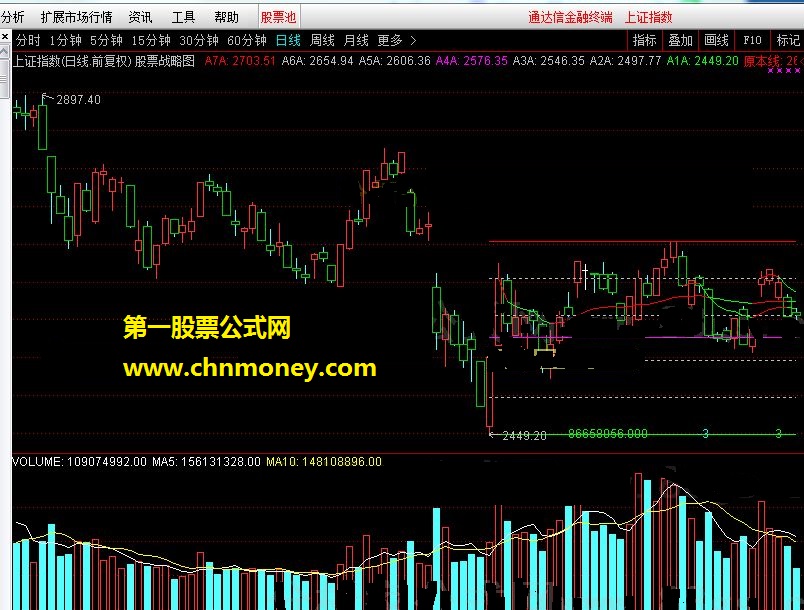
股票战略图破解完全加密公布指标下载 通达信源码加密
- 指标公式类型:通达信公式
- 公式推荐星级:

- 指标公式安全:已通过5款杀毒软件查杀,请放心下载!
- 公式更新时间:2018-12-10 06:56:56
- 指标公式标签:
- 公式运行环境: WinXP/Win7/Win8/Win10/Win All
- 指标公式语言:用简体中文编写
指标公式详细说明
股票战略图 ,仅仅用于大盘,
{公式名称: 股票战略图
公式描述: 股票战略图
无参数
公式类型: 技术指标公式-图表型
画线方法: 主图叠加
公式版本: 0
显示小数: 缺省位数
坐标线位置: 自动
额外y轴分界: 无
参数精灵:无
用法注释:无
公式源码:}
stickline(open>close,close,open,3,1),color00cc00;
var1:=barslast(low=llv(low,360));
var2:=ref(low,var1);
var3:=barslast(high=hhv(high,var1));
var4:=ref(high,var3);
var5:=if(currbarscount<=const(var1+1),const(if(1,var4,var4)),drawnull);
var6:=if(currbarscount<=const(var1+1),const(if(1,var2,var2)),drawnull);
var7:=(var5+var6)/2;
var8:=var6+(var5-var6)*0.191;
var9:=var6+(var5-var6)*0.382;
var10:=var6+(var5-var6)*0.618;
var11:=var6+(var5-var6)*0.809;
a7a:if(currbarscount<=const(var1+1),const(if(1,var4,var4)),drawnull),colorred;
a6a:if(currbarscount<=const(var1+1),const(if(1,var11,var11)),drawnull),dotline,colorligray;
a5a:if(currbarscount<=const(var1+1),const(if(1,var10,var10)),drawnull),dotline,colorligray;
a4a:if(currbarscount<=const(var1+1),const(if(1,var7,var7)),drawnull),colormagenta;
a3a:if(currbarscount<=const(var1+1),const(if(1,var9,var9)),drawnull),dotline,colorligray;
a2a:if(currbarscount<=const(var1+1),const(if(1,var8,var8)),drawnull),dotline,colorligray;
a1a:if(currbarscount<=const(var1+1),const(if(1,var2,var2)),drawnull),colorgreen;
原本线:if(currbarscount<=const(var1),ma(close,var1),drawnull),colorred;
原本跌:if(currbarscount<=const(var1),if(原本线<ref(原本线,1),原本线,drawnull),drawnull),colorgreen;
h本线:if(currbarscount<=const(var3+1),ma(close,var3),drawnull),colorred;
h本跌:if(currbarscount<=const(var3+1),if(h本线<ref(h本线,1),h本线,drawnull),drawnull),colorgreen;
var12:=barslast(low=llv(low,var3));
l本线:if(currbarscount<=const(var12+1),ma(close,var12),drawnull),colorred;
l本跌:if(currbarscount<=const(var12+1),if(l本线<ref(l本线,1),l本线,drawnull),drawnull),colorgreen;
var13:=const(var1+1);
var14:=(a2a+a1a)/2;
ggh1:drawtext(currbarscount=var13,var14,238),coloryellow;
var15:=(a3a+a2a)/2;
ggh2:drawtext(currbarscount=var13,var15,239),coloryellow;
var16:=(a4a+a3a)/2;
ggh3:drawtext(currbarscount=var13,var16,240),coloryellow;
var17:=(a5a+a4a)/2;
ggh4:drawtext(currbarscount=var13,var17,241),coloryellow;
var18:=(a6a+a5a)/2;
ggh5:drawtext(currbarscount=var13,var18,242),coloryellow;
var19:=(a7a+a6a)/2;
ggh6:drawtext(currbarscount=var13,var19,243),coloryellow;
var20:=barslast(indexl=llv(indexl,360));
var21:=ref(indexl,var20);
var22:=barslast(indexh=hhv(indexh,var20));
var23:=ref(indexh,var22);
yu21:if(currbarscount<=const(var20+1),const(if(1,var23,var23)),drawnull),colorred;
yu22:if(currbarscount<=const(var20+1),const(if(1,var21,var21)),drawnull),colorgreen;
var24:=const(intpart((indexc-yu21)/yu21*100));
yu41:const(intpart((close-var5)/var5*100)),nodraw;
pva4:drawtext_fix(islastbar,0.78,10,0,244),colorwhite;
pva3:drawnumber_fix(islastbar,0.84,10,0,var24),colorcyan;
pva2:drawtext_fix(islastbar,0.87,10,0,245),coloryellow;
pva1:drawnumber_fix(islastbar,0.93,10,0,yu41),colorgreen;
var25:=const(intpart(winner(close)*100));
pva11:drawtext_fix(islastbar,0.71,10,0,246),colorred;
pva12:drawnumber_fix(islastbar,0.76,10,0,var25),colorgreen;
var26:=const(intpart(close*finance(7)/100000000));
pva13:drawtext_fix(islastbar,0.63,10,0,247),colormagenta;
pva14:drawnumber_fix(islastbar,0.68,10,0,var26),colorgreen;
var27:=filter(month=2 and (day=3 or day=5),2);
var28:=filter(month=2 and (day=18 or day=20),2);
var29:=filter(month=3 and (day=5 or day=7),2);
var30:=filter(month=3 and (day=20 or day=22),2);
var31:=filter(month=4 and (day=4 or day=6),2);
var32:=filter(month=4 and (day=19 or day=21),2);
var33:=filter(month=5 and (day=6 or day=8),2);
var34:=filter(month=5 and (day=20 or day=22),2);
var35:=filter(month=6 and (day=5 or day=7),2);
var36:=filter(month=6 and (day=20 or day=22),2);
var37:=filter(month=7 and (day=6 or day=8),2);
var38:=filter(month=7 and (day=22 or day=24),2);
var39:=filter(month=8 and (day=7 or day=9),2);
var40:=filter(month=8 and (day=22 or day=24),2);
var41:=filter(month=9 and (day=7 or day=9),2);
var42:=filter(month=9 and (day=22 or day=24),2);
var43:=filter(month=10 and (day=7 or day=9),2);
var44:=filter(month=10 and (day=22 or day=24),2);
var45:=filter(month=11 and (day=7 or day=9),2);
var46:=filter(month=11 and (day=22 or day=24),2);
var47:=filter(month=12 and (day=6 or day=8),2);
var48:=filter(month=12 and (day=21 or day=23),2);
var49:=filter(month=1 and (day=5 or day=7),2);
var50:=filter(month=1 and (day=19 or day=21),2);
var51:=1.006;
var52:=if(currbarscount<=const(10),const(10),drawnull);
drawtext(var52 and var27=1,high*var51,248),coloryellow;
drawtext(var52 and var28=1,high*var51,249),coloryellow;
drawtext(var52 and var29=1,high*var51,250),coloryellow;
drawtext(var52 and var30=1,high*var51,251),coloryellow;
drawtext(var52 and var31=1,high*var51,252),coloryellow;
drawtext(var52 and var32=1,high*var51,253),coloryellow;
drawtext(var52 and var33=1,high*var51,254),coloryellow;
drawtext(var52 and var34=1,high*var51,255),coloryellow;
drawtext(var52 and var35=1,high*var51,256),coloryellow;
drawtext(var52 and var36=1,high*var51,257),coloryellow;
drawtext(var52 and var37=1,high*var51,258),coloryellow;
drawtext(var52 and var38=1,high*var51,259),coloryellow;
drawtext(var52 and var39=1,high*var51,260),coloryellow;
drawtext(var52 and var40=1,high*var51,261),coloryellow;
drawtext(var52 and var41=1,high*var51,262),coloryellow;
drawtext(var52 and var42=1,high*var51,263),coloryellow;
drawtext(var52 and var43=1,high*var51,264),coloryellow;
drawtext(var52 and var44=1,high*var51,265),coloryellow;
drawtext(var52 and var45=1,high*var51,266),coloryellow;
drawtext(var52 and var46=1,high*var51,267),coloryellow;
drawtext(var52 and var47=1,high*var51,268),coloryellow;
drawtext(var52 and var48=1,high*var51,269),coloryellow;
drawtext(var52 and var49=1,high*var51,270),coloryellow;
drawtext(var52 and var50=1,high*var51,271),coloryellow;
var53:=close>ref(close,1) and indexc<ref(indexc,1);
fh200:drawtext(var53 and currbarscount<=const(10),high*1.01,272),coloryellow;

指标公式下载地址
好公式网提供全网最全的指标公式软件,感谢您的支持!鼠标双击图片可看大图!下载请点击右侧“立即下载”,如只有源码,请点击本页面右侧的导入方法按图导入!
本站指标基于网友分享,仅供研究自学,勿作他用,本站对下载使用不承担任何责任!
上一指标公式:百年好和观景海市蜃楼-指标下载 通达信海市蜃楼
下一指标公式:金蝴蝶波段底破解指标下载 通达信源码公式
相关通达信公式推荐
【顶底趋势】自用主图公式 提前预知底部 下跌中股票提示变盘在即 等待突破后介入 源码
通达信股价重心双线主图指标,股票分析极品利器,简单两根线、会用百战百胜
【竞价捉妖】一进二选股公式,刺客出品,实战强,9日锋龙股份涨停,8日康强电子、朗迪集团涨停
锚定战法改进副图/选股指标 原创 稳定盈利的开始 有缘者得之 通达信 源码
游资协战看盘主图指标 只做上升趋势个股 通达信 源码
【刺客出品】竞价抓牛副图/选股指标,一进二竞价公式,8月5日华西股份、8月4日多伦科技、曾捉妖股中通客车,附战法
长短趋势通道+量学买卖+牛熊量能,拿出经常获利的组合指标分享给各位股友,今天心情好,股票又赚钱了!
用BIAS搭配kd编写来确定要买入股票的BIASKD百里挑一选股公式
中轴之竞价,趋势系统进阶之竞价战法,如何在趋势系统中构建一个竞价战法?
发一个自己寻找主升浪的【资金组合】公式,股票炒得是什么,就是资金!
【强势趋势●VIP珍藏战法】副图/选股指标,抓被庄家控盘上行强势股,原创、无未来、出票少
岛形反转,定位买卖点的经典战法指标,随便复制到自己的主图,通达信、无加密
连板高阴战法副图/选股指标,庄家高位洗盘后走强,附原理和实战要点!
超级筹码布林战法主图/选股指标,抓牛股新思路、新利器,非精品不发,简单好用源码开源
指标公式下载注意
☉ 好公式网发布的指标公式主要用于软件技术面分析,仅供参考,勿用于实际操作,据此操作风险自负!
☉ 解压密码:www.goodgongshi.com 就是好公式网域名,希望大家看清楚,切勿输错。
☉ tnc和tni格式指标公式,仅可以用通达信软件引入使用,例如可以用通达信软件引入使用指标公式;
☉ tne格式指标公式,仅可以用通达信软件公式编辑器5.0版导入,高版本兼容低版本;
☉ fnc格式指标公式,可以用大智慧软件新一代高速行情分析系统股票软件使用,少部分可以用分析家软件引入使用;
☉ alg格式指标公式,仅仅可以用飞狐交易师软件引入使用;exp格式指标公式,仅可以用大智慧经典版软件引入使用;
☉ hxf格式指标公式,仅可以用同花顺软件引入使用。
☉ 如果您发现下载软件链接错误,请联系管理员报告错误。
☉ 好公式网欢迎各位网友帮忙宣传转发本站网址,有您的支持,我们会做得更好!
☉ 本文股票战略图破解完全加密公布指标下载 通达信源码加密仅供学习研究。
猜你喜欢
网友爱看
可以看清真假拉升——真实量能MACD副图指标,通达信,源码分享!
每天4个点以上,绝不是梦,小赚大富指标(副图 通达信 贴图)当日逢低买进,第二天赚它几个点下载
龙腾四海(通达信/同花顺通用 无未来 副图 效果图)下载
布林至尊-主图指标详解及下载 通达信源码布林
变色KDJ指标公式 通达信变色
精准跟庄买进 副图 无未来函数 通达信函数精准
神针超准底部副图指标,很准的波段公式,底部发神针信号!
简单KD指标(源码 通达信 副图 贴图)无未来好公式,代码简简单单下载
人才群阴线捉妖指标(主图 通达信 贴图)K线变三色是捉妖机会,阴线买出现是短线机会下载

 粤公网安备 44010602010581号