首次发行日线级别地量大盘个股K线同框主图指标下载
- 指标公式类型:通达信公式
- 公式推荐星级:

- 指标公式安全:已通过5款杀毒软件查杀,请放心下载!
- 公式更新时间:2019-08-04 08:24:20
- 指标公式标签:
- 公式运行环境: WinXP/Win7/Win8/Win10/Win All
- 指标公式语言:用简体中文编写
指标公式详细说明
首次发行日线级别地量大盘个股k线同框主图指标
将研究的二个看盘主图一同打包,源码奉献给大家,各自自行优化。
第一套 日线级别地量看盘主图
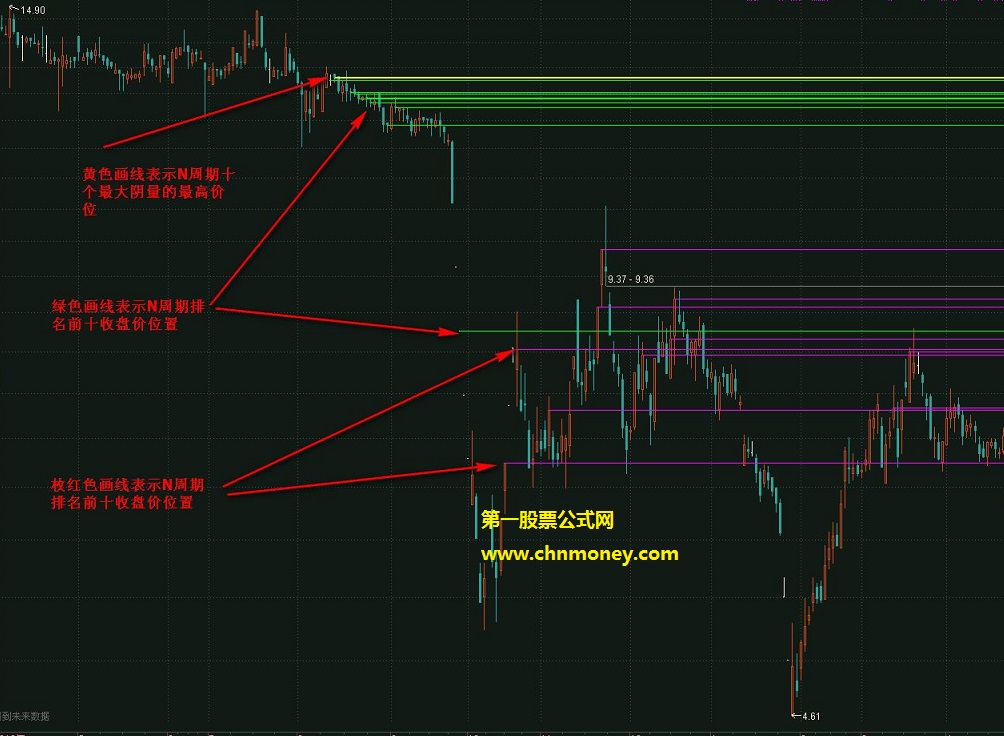
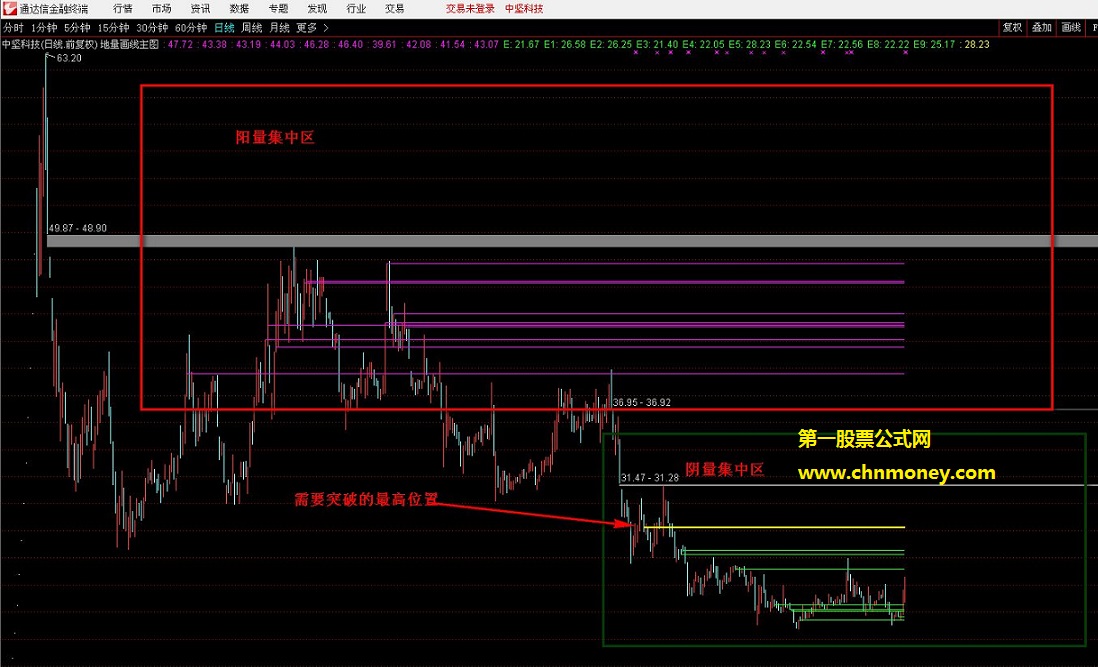
指标构思:这套日线级别的地量画线是将n(可自行调节)周期内10根最大阳量和十根最小阴量连线,方便您参考n周期内放量和缩量集中在哪个价位。
枚红色水平画线表示阳量 绿色水平画线表示阴量,黄色加粗水平画线表示阴量最高画线。根据画线可以参考n周期阳量 阴量集中在哪个价位,参考买进 卖出
阳量取n周期内最大排名前十,阴量取n周期内最小(地量)排名前十画线
第二套 大盘个股k线同框主图
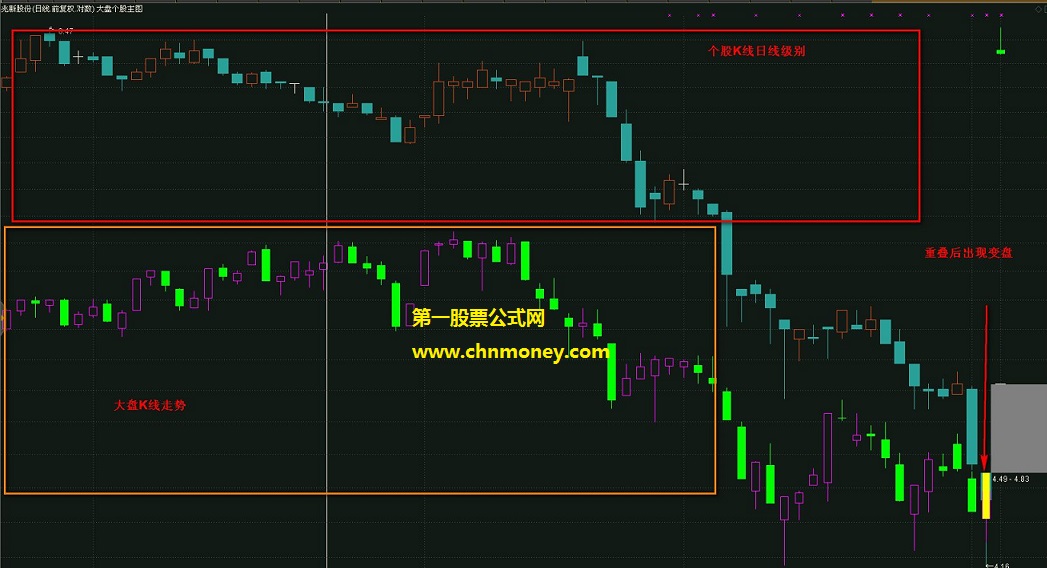
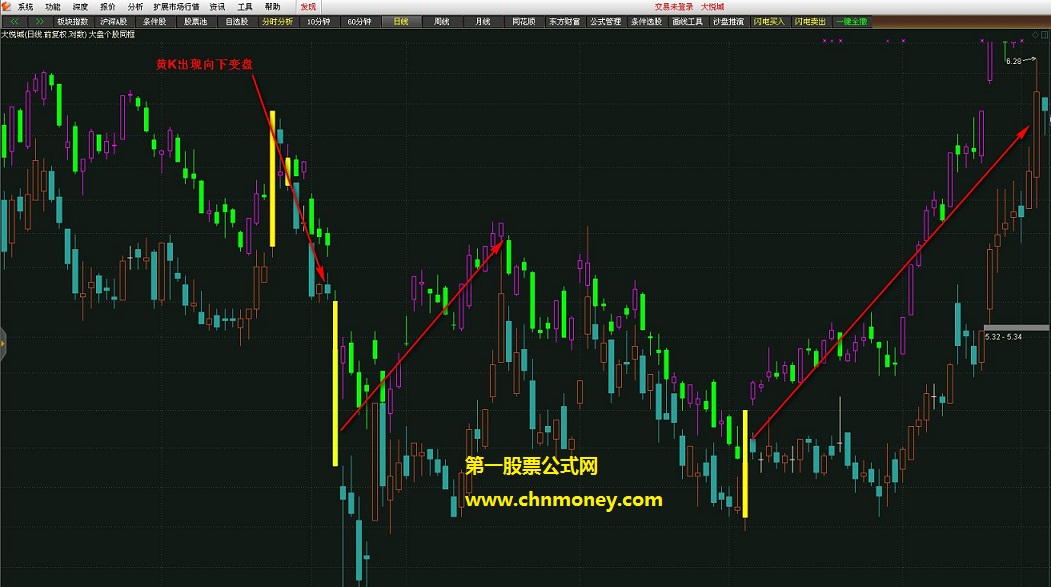
指标构思:将大盘和个股 的k线走势变通后,放在同一个主图里,当k线出现重合一般会有变盘时间窗口。使用后请仔细观察。
当出现黄色k线时如果在底部请注意向上变盘。如果在高位注意参考向下变盘!
指标只是给你参考,不可能100%准确!!
{妞妞地量日线看盘主图}
n:=350;
y1:=c>o or (c=o and c>=ref(c,1));
y2:=c<o or (c=o and c<ref(c,1));
l1:=if(y1,vol,0);
l2:=if(y2,vol,9999999999);
t1:=const(findhighbars(l1,0,n,1));
t2:=const(findhighbars(l1,0,n,2));
t3:=const(findhighbars(l1,0,n,3));
t4:=const(findhighbars(l1,0,n,4));
t5:=const(findhighbars(l1,0,n,5));
t6:=const(findhighbars(l1,0,n,6));
t7:=const(findhighbars(l1,0,n,7));
t8:=const(findhighbars(l1,0,n,8));
t9:=const(findhighbars(l1,0,n,9));
t10:=const(findhighbars(l1,0,n,10));
d1:=const(findlowbars(l2,0,n,1));
d2:=const(findlowbars(l2,0,n,2));
d3:=const(findlowbars(l2,0,n,3));
d4:=const(findlowbars(l2,0,n,4));
d5:=const(findlowbars(l2,0,n,5));
d6:=const(findlowbars(l2,0,n,6));
d7:=const(findlowbars(l2,0,n,7));
d8:=const(findlowbars(l2,0,n,8));
d9:=const(findlowbars(l2,0,n,9));
d10:=const(findlowbars(l2,0,n,10));{好公式网-最好的股票公式网站 www.goodgongshi.com}
drawline(currbarscount=t1+1,c,islastbar,ref(c,t1),0),colormagenta;
drawline(currbarscount=t2+1,c,islastbar,ref(c,t2),0),colormagenta;
drawline(currbarscount=t3+1,c,islastbar,ref(c,t3),0),colormagenta;
drawline(currbarscount=t4+1 ,c,islastbar,ref(c,t4),0),colormagenta;
drawline(currbarscount=t5+1 ,c,islastbar,ref(c,t5),0),colormagenta;
drawline(currbarscount=t6+1 ,c,islastbar,ref(c,t6),0),colormagenta;
drawline(currbarscount=t7+1 ,c,islastbar,ref(c,t7),0),colormagenta;
drawline(currbarscount=t8+1 ,c,islastbar,ref(c,t8),0),colormagenta;
drawline(currbarscount=t9+1 ,c,islastbar,ref(c,t9),0),colormagenta;
drawline(currbarscount=t10+1 ,c,islastbar,ref(c,t10),0),colormagenta;
e:drawline(currbarscount=d1+1 ,c,islastbar,ref(c,d1),0),colorgreen;
e1:drawline(currbarscount=d2+1,c,islastbar,ref(c,d2),0),colorgreen;
e2:drawline(currbarscount=d3+1,c,islastbar,ref(c,d3),0),colorgreen;
e3:drawline(currbarscount=d4+1 ,c,islastbar,ref(c,d4),0),colorgreen;
e4:drawline(currbarscount=d5+1,c,islastbar,ref(c,d5),0),colorgreen;
e5:drawline(currbarscount=d6+1 ,c,islastbar,ref(c,d6),0),colorgreen;
e6:drawline(currbarscount=d7+1,c,islastbar,ref(c,d7),0),colorgreen;
e7:drawline(currbarscount=d8+1,c,islastbar,ref(c,d8),0),colorgreen;
e8:drawline(currbarscount=d9+1 ,c,islastbar,ref(c,d9),0),colorgreen;
e9:drawline(currbarscount=d10+1 ,c,islastbar,ref(c,d10),0),colorgreen;
hh:=max(max(max(max(max(max(max(max(max(e,e1),e2),e3),e4),e5),e6),e7),e8),e9);
t:=barslast(c=const(hh));
drawline(currbarscount=const(t)+1,c,islastbar,ref(c,t),0),coloryellow,linethick2;
将大盘和个股 的k线走势变通后,放在同一个主图里,当k线出现重合一般会有变盘时间窗口。使用后请仔细观察。
当出现黄色k线时如果在底部请注意向上变盘。如果在高位注意参考向下变盘!
指标只是给你参考,不可能100%准确!!
{大盘和个股同框主图}
n:=70;
cy:=inblock('创业板');
zxb:=inblock('中小企业');
sz:=inblock('上证a股');
h2:=if(zxb=1,"399005$h",if(cy=1,"399006$h",if(sz=1,"999999$h","399001$h")));
o2:=if(zxb=1,"399005$o",if(cy=1,"399006$o",if(sz=1,"999999$o","399001$o")));
l2:=if(zxb=1,"399005$l",if(cy=1,"399006$l",if(sz=1,"999999$l","399001$l")));
c2:=if(zxb=1,"399005$c",if(cy=1,"399006$c",if(sz=1,"999999$c","399001$c")));
dl:=const(llv(l2,n));
dh:=const(hhv(h2,n));
dc:=dh-dl;
gl:=const(llv(l,n));
gh:=const(hhv(h,n));
gc:=gh-gl;
b:=gc/dc;
cc:=gl+(c2-dl)*b;
oo:=gl+(o2-dl)*b;
ll:=gl+(l2-dl)*b;
hh:=gl+(h2-dl)*b;
tj0:=between(min(cc,oo),min(c,o),max(c,o)) or between(max(cc,oo),min(c,o),max(c,o));
tj1:=between(min(c,o),min(cc,oo),max(cc,oo)) or between(max(c,o),min(cc,oo),max(cc,oo));
tj:=tj0 or tj1;
t:=barslast(tj);
gg:=max(max(max(c,o),cc),oo);
dd:=min(min(min(c,o),cc),oo);
drawkline(h,o,l,c);
stickline(c2>o2,cc,hh,0,0),colormagenta;
stickline(c2>o2,cc,oo,2,1),colormagenta;
stickline(c2>o2,ll,oo,0,0),colormagenta;
stickline(c2<o2,oo,hh,0,0),colorgreen;
stickline(c2<o2,cc,oo,2,0),colorgreen;
stickline(c2<o2,ll,cc,0,0),colorgreen;
stickline(t=0,dd,gg,1.5,0),coloryellow;


指标公式下载地址
好公式网提供全网最全的指标公式软件,感谢您的支持!鼠标双击图片可看大图!下载请点击右侧“立即下载”,如只有源码,请点击本页面右侧的导入方法按图导入!
本站指标基于网友分享,仅供研究自学,勿作他用,本站对下载使用不承担任何责任!
上一指标公式:不依赖传统自创涨跌仓位副图指标下载
下一指标公式:松仕变色快线下载
相关通达信公式推荐
万金难觅的分段止盈量化策略指标,珍藏极品主图+副图,首次公开发布!
润丰霖发财——分段止盈,万金难觅的分段止盈量化指标策略,首次公开,效用宏大
小庞MA认主副图指标,首次拉升回调后,可以捕捉二次启动!
黄金起爆2 妖股起爆2 起爆选股2 首次出现红黄柱买入 通达信 主图/副图/选股 源码
MACD多头首次共振选股(通达信公式 副图 选股 实测图 源码)
【利用分时量能抓涨停】指标,选首次高开突破平台个股,牛不牛效果说了算
2021年首次分享:极品波段指标(副图 通达信 贴图)来自自用组合公式,效果绝对稳准狠下载
双重确认强势股指标(副图 通达信 截图)红色是首次确认,紫色是再次确认下载
至尊红量抓牛主图指标,首次创新高即标示,异动放量立马抓牛下载
冲击波指标(副图 通达信 贴图)用来捉必涨停,此是首次公开,有使用说明还有选股技巧下载
虚拟涨跌指标(副图 通达信 贴图)日线级别选股公式,画涨停与跌停的虚拟线下载
通达信版本的周线级别三角洲彩线公式!全网络很多网友都在找的,现在流传出来仅就此一份!下载
庄家低买高卖赢利指标,首次发布,原创好副图!下载
周线级别的选股指标,飞龙在天选股公式(副图 通达信 贴图)源码分享下载
指标公式下载注意
☉ 好公式网发布的指标公式主要用于软件技术面分析,仅供参考,勿用于实际操作,据此操作风险自负!
☉ 解压密码:www.goodgongshi.com 就是好公式网域名,希望大家看清楚,切勿输错。
☉ tnc和tni格式指标公式,仅可以用通达信软件引入使用,例如可以用通达信软件引入使用指标公式;
☉ tne格式指标公式,仅可以用通达信软件公式编辑器5.0版导入,高版本兼容低版本;
☉ fnc格式指标公式,可以用大智慧软件新一代高速行情分析系统股票软件使用,少部分可以用分析家软件引入使用;
☉ alg格式指标公式,仅仅可以用飞狐交易师软件引入使用;exp格式指标公式,仅可以用大智慧经典版软件引入使用;
☉ hxf格式指标公式,仅可以用同花顺软件引入使用。
☉ 如果您发现下载软件链接错误,请联系管理员报告错误。
☉ 好公式网欢迎各位网友帮忙宣传转发本站网址,有您的支持,我们会做得更好!
☉ 本文首次发行日线级别地量大盘个股K线同框主图指标下载仅供学习研究。

 粤公网安备 44010602010581号